

Gender Pay Gap Special
Gender Pay Gap Special
As promised, a more in-depth look at regional Gender Pay Gap figures published at the end of October - with a quick round-up of everything else too

Last week I threw a single, solitary figure into the newsletter - 5.8%.
That’s the North East’s gender pay gap for median gross hourly earnings. That figure is the lowest across the English regions, and is a reduction of 13.1 percentage points over the past 25 years.
It’s not parity, but it’s not bad, right? Well.
This week's soundtrack is a 1977 anti-capitalist, pro-feminist rallying cry courtesy of Poly Styrene.
First, some foundational bits
The Gender Pay Gap measures the median earnings of men and women. The overall figure shows just that, the overall gap, expressed as a percentage. You can then cut it by things like age, location of home or work, industry and occupation type.
What it isn’t is a comparison of what men and women earn for the same role, nor does the headline figure - which reports the difference for full-time workers - take account of the higher proportion of women in part-time roles.
There are measures of the Gender Pay Gap going back through the years, but it’s only since 2017 that businesses with more than 250 employees have been required to report their gap.
This briefing paper from the House of Commons Library goes into more detail on the background and definitions, and also contains a list of some influences on the pay gap figure - stuff like age, industry, and whether you work in the public or private sector.
Okay, the numbers
For this I’ll be drawing from the ONS, specifically the ‘Gender pay gap in the UK: 2022’ and ‘Employee earnings in the UK: 2022’ datasets. Some of the numbers I use are right in the bulletins, but some are deeper in the spreadsheets, so if you want to find the source for anything in particular, shout at me and I’ll dig it out.
The national gender pay gap figure for full-time work is 8.3%. For part time jobs it is -2.8%, as in women working part time earn more than men working part time. However, across all employment, the gap is 14.9% - this reflects the significantly higher number of women in part time roles, which tend to earn less than full-time equivalents.
So, as usual, the headline figure that gets reported hides the true scale of the issue.
That said, for simplicity, I’ll be quoting the full-time median figure, unless otherwise stated. That's for ease of direct comparisons, and because even the under-estimate is bad enough.
Join me for a webinar on 29th November
I'm speaking at a lunchtime webinar with the IoD on 29th November, explaining how I approach this sort of stuff.
I'll be discussing the use of public data for business planning and content creation - and it's open to everyone, IoD members and non-members.
North East vs Tees Valley LEPs
The North East’s full-time median overall is 5.8%, but the split is 5.3% in the North East LEP area and 8.3% in the Tees Valley.
That’s for working location, but if you look at people who call those LEP regions home then the gaps are 6.7% for NELEP and 10.9% for the Tees Valley.
There's significant movement between the two LEP areas, so there's overlap in the people we're talking about in each case. Sectoral make up will play a role, with Teesside home to more jobs in sectors like manufacturing and skilled trade occupations where the gap is wider.
Public vs Private Sector
The public sector’s pay gap in the North East is 3.6%…the private sector’s is 14.0%. That’s a really big spread, nationally it’s 11.1% for the public sector and 13.8% for the private sector. We have a lot of people employed in the health, care and education industries, so it probably reflects the situation in those sub-sectors rather than the public sector more generally.
Industry and Occupation
There are some limited insights into the industry and occupation breakdowns in the North East - this type of figure tends to get a bit sketchy due to small sample sizes but there are some things we can draw out:
Service industries have a lower pay gap - 4.5% (8.5% nationally)
Wholesale and retail trade has a larger one - 12.0% (8.2% nationally) - but it’s 6.0% (6.7% nationally) if you exclude the motor trade
The accommodation and food sector has a pay gap of -3.3%, reflecting the high number of women working in the sector (+1.6% nationally)
Professional occupations have a gap of 7.3%, compared to 9.4% nationally
Administrative and secretarial 4.0%, compared to 6.2% nationally
The numbers aren’t are high quality, but skilled trades are at 21.9%, compared to 18.2% nationally
Age
This is where it gets really interesting. Here’s how the North East’s gender pay gap breaks down by age group.

This is, depressingly, the arc of the gender pay gap more generally, not just in-region.
The pay differential for men and women is close through the first few years of work, before accelerating rapidly once you get past the average age a woman becomes a mother - which is around age 30.
There’s another really important age-related point to consider, which Mel Barfield rightly tweeted at me:

A pay gap isn’t something that goes away when you finish work, it means a smaller pension pot, which means a gap in retirement income too. That which disadvantages women in the workplace follows them out of it too - with Legal & General estimating the average pension pot for a woman is half that of a man.
It’s a timebomb, basically - fix this or face decade after decade of policy problems.
Why might this be happening?
Hey, can anyone think of anything that tends to happen around age 30 which might influence women's relationship with work?? Yeah, thought you might have an idea.
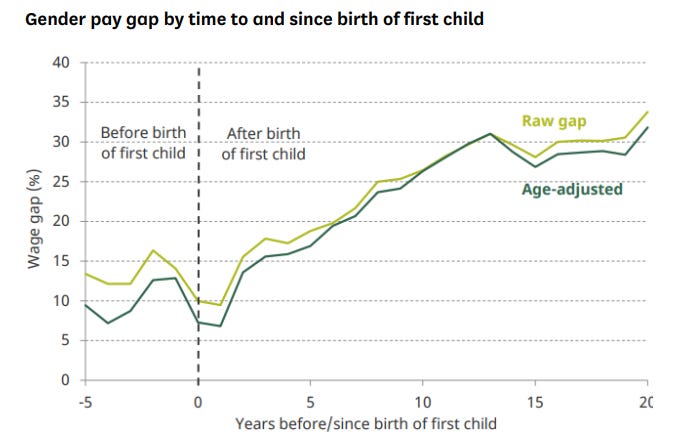
The motherhood pay penalty is a well-established issue. The Institute for Fiscal Studies estimates that mothers earn about 30% less than similarly educated fathers by the time their child is 13. This chart from here sums it up.
Mothers are more likely to take on part time work to balance childcare responsibilities, earning less and limiting opportunities for progression.
Mothers are more likely to take career breaks when becoming a parent - the take up of Shared Parental Leave is low, with just 2% of partners taking leave.
There’s also a gender split by industry, with 21% of women employed in health and social care roles, making up 78% of jobs in that industry, alongside 70% in education. It’s easy to see how that structural imbalance would impact the pay gap.
Why might the North East’s overall figure be better than average?
Good question. Two main things occur to me:
The sector make-up in the region. The North East LEP area’s top three employers are health, education and retail. So, two dominated by the public sector and one where the sector gap is negative
North East pay is lower overall, and the gap gets wider at the higher pay levels. See this study from Germany where they find less of a pay gap in regions with lower pay levels - including the former East Germany - and fairly stable pay for women across the country. In those regions where they is a pay gap, it’s because men’s pay is higher.
The Gender Pay Gap: what can we do about it?
FIX CHILDCARE AND PARENTAL LEAVE, he screams at the top of his lungs.
Childcare is so expensive (£260 per week) it acts as an effective tax on working for mothers. If you’ve got two kids below school age, forget about it. Subsidise childcare and you’ll reap the benefits elsewhere in the system through more productive and economically active people.
Parental leave is unaffordable for most families, which is why take-up is so low. Require pay at above statutory minimums; give proper standalone leave to partners rather than requiring them to share the mother’s leave entitlement; encourage businesses to support it more widely and make it the norm to take it. As someone who has taken it, I’m available as a vocal advocate.
I'd also appeal to businesses to ditch the outdated idea that certain roles can only be done full-time. Senior roles can be done part-time, they can be job shared, it's possible to be flexible.
Stat of the week
£10,213
The difference between the North East mean annual pay for women (£23,991) and men (£34,204).
Quick Round-up
I’ve messed with the newsletter's format this week, and for that I make no apologies. But here are some other things which caught my eye this week:
New research from Which? has found 45% of areas in the North East are in “dire need of extra support” over the affordability of food. The North East as a region ranks worst in the country and Houghton and Sunderland South, North West Durham, Blaydon and Bishop Auckland are in the top ten worst-effected constituencies. (I first saw that story in the excellent Northern Agenda newsletter, which you can sign up to here)
Tees Valley Mayor Ben Houchen is reportedly on the list for a peerage in Boris Johnson’s resignation honours. I’d guess he could be Baron Houchen of Ingleby Barwick or wherever and still be mayor…and there are lots of examples of people having dual roles, but it probably isn’t compatible with a ministerial job in the Government. And that’s surely what you’d be angling for, isn’t it?
The Boundary Commission has published some revised proposals for redrawing parliamentary constituency boundaries across the country. The North East stands to lose two of its MPS, and you can view the proposals here.
There was data on housebuilding published…which basically says we didn’t build enough houses in the year to March. I might dig into the local authority level stuff next week!
The ONS has published some Census 2021 figures and launched a tool for mapping Census data, which all looks really interesting but I haven’t had a chance to look/play with it yet. Paul Swinney at Centre for Cities has though:
I wrote most of this newsletter before Sir Gavin Williamson officially became a distraction, but I want to say that “becoming a distraction” is to resignations what “I’m sorry people were upset” is to apologies and it makes me sigh


What I've been reading/enjoying this week
This from Georgina Sturge at the House of Commons Library in the Guardian, which speaks to my soul on bad data and policymaking. The Reinhart-Rogoff example is a personal 'favourite' (definitely not the right word, but oh well) and is particularly ridiculous, given this country based a decade of economic policy on a dodgy Excel spreadsheet.
This piece about professional footballer David Wheeler and the psychology of a hyper masculine environment.
This article on the crisis coming in speech and language therapy, as more and more kids require additional support
What to look out for in the next week or so
Whether any agreements come out of the COP27 climate change conference…don’t hold your breath
GDP and Trade stats on Friday 11th Nov
Labour market figures next Tuesday, which I’ll do my best to summarise for the newsletter on Wednesday
PMQs later today, as well as some backbench business on levelling up rural Britain - Parliament is then in recess for a couple of days and back on Monday
Feedback and finding me
This is a work in progress, so all feedback is gratefully received.
You can email me on worroom@substack.com.
I’m @arlenpettitt on Twitter, and you’ll find me on LinkedIn.