

On euphemism and anecdote
On euphemism and anecdote
The Centre for Social Justice, deprivation, homelessness and other cheerful subjects in this week's newsletter

When I was doing my masters at UCL, one of the places I would go to work was Senate House. The libraries there are open to students at any of the colleges which are part of the University of London, and there’s a certain pleasure which comes from walking up to (and getting lost in) the building best known as the inspiration for the Ministry of Truth in Orwell’s 1984.
It wasn’t much of a stretch, given it was actually the headquarters of the Ministry of Information - which had responsibility for publicity and propaganda during the war.
When you spend as much time reading policy documents and listening to political figures chat nonsense as I do, you could reach for Orwell approximately every 20 minutes.
I try to limit myself to a couple of references a day (coincidentally the same rule I apply to caffeinated drinks and Fox’s Crunch Cream biscuits), but it’s especially difficult to resist when it comes to the naming of think tanks.
A personal favourite is the Centre for Social Justice.
Now, social justice is a concept with no fixed definition, and if you Google it you’ll get a patchwork of political philosophy going back to Plato. How we think of it now is probably most influenced by John Rawls - who is recent by political philosophy standards in that he was writing in the 1970s. Every politics student reads him, especially A Theory of Justice, which was published in 1971 and pushed for equality of opportunity. It contains this concept for a ‘veil of ignorance’, which argues if we were all tasked with designing a society, but without any information about where we’d sit within it, we’d probably choose to make it as equal as possible.
Unfortunately, we tend to work unveiled, wearing our biases and privileges instead.
That’s a bit of the sense I got from the Centre for Social Justice’s most recent report, Two Nations, which looks at poverty in the UK and got some headlines over the weekend for suggesting we’re on our way to a social divide not seen since the Victorian era.
The report starts off with lots of nice, juicy data-heavy analysis.
It’s got stuff on productivity (North East -17.4% compared to the UK average), which I’ve written about recently.
It’s got stuff on the effective inflation rate by income decile, which identifies that those on lower incomes have a higher effective rate. That section makes the argument that places where house prices are lower also expose more people to the hit from mortgage rates increases, given lower income households are more likely to be homeowners in those places. I hadn't considered that impact, but it's a significant one in this region.
It also has stuff on insecure employment, with the North East ranking second across UK regions with just shy of 18% of total employment in insecure sectors - most notably about 9% from the hospitality sector.
But the report then starts letting itself down.
The data gives way to weird ill-informed analysis and morality tales informed by unattributed anecdotes.
There’s a section on transport which suggests the reason Seahouses has a lower average income than Morpeth is its connectivity to Newcastle…not that it’s another 30 miles up the coast, is about a tenth the size, and isn’t the county seat of Northumberland.
There’s then a section on health and benefits which contains five back-to-back, unattributed anecdotes from the North East to suggest people are gaming a system which is too generous. That has a bit on ADHD or anxiety diagnoses for children and “financially that’s helpful for the family” how someone “put on a limp” in Stockton, how a woman “spent £600 a week on cigarettes and alcohol had two disabled children, so she was claiming money for them”.
The report uses these snapshots to put benefit claimants up against the hard-working people who run the services they access - there’s one saying they were getting paid £1,500 to run drug and alcohol treatment for users who were claiming £2,000 in benefit, another saying people were getting £3,000 from Personal Independence Payments and why would you work.
Now, we don’t know any of these cases - perhaps they’re true - but are they representative? And why in that section do all the examples come from the North East?
There’s another section on attitudes to work, which includes stories of multiple generations of worklessness from Newcastle and South Shields, and stuff about service users in North Tyneside working in hospitality where progression is limited.
It ties all of this to aspiration - rather than opportunity - and even cites a charity in the North East ‘explaining’ how women “choose the known (such as having another baby and prolonging the time they could be on welfare with no work requirements) than moving into the unknown of work”.
It perhaps won't surprise you if I reveal to you (or remind, for those of you who are already acquainted) that the Centre for Social Justice was co-founded by Iain Duncan Smith in 2004, shortly after he was ousted as Tory leader.
As Work and Pensions Secretary, his fanatical devotion to cost-cutting in welfare left us with a system where half a million more households are in absolute poverty than would have been under the 2010/11 system.
I tend to find there's a curious moralising which underpins these crusades.
It's ironic the report is called Two Nations and bemoans the poverty divide in this country, while at the same time painting a lazy picture of unworthy benefit claimants laughing all the way to their dealer or the off license.
There's an argument that this is the perception the public has of the benefits system and those who access it, but the public are not renowned for their fact-based analysis and presenting those views without challenge is as dangerous as it is derivative.
There are many reasons why we shouldn’t make policy based on public opinion, just as we shouldn't make policy based on prejudice.
I concede I have plenty of prejudice of my own - not least against centre-right think tanks that give up on evidence halfway through their reports.
I also concede there's no politics without philosophy or ideology, but we really should try better to avoid it when we're talking about as fundamental an issue as poverty, and as fundamental a right as opportunity.
One thing I get asked fairly often is how I can tell whether a source is reliable, especially when it comes to think tanks.
My answer is you have to look at their mission and purpose, who founded them, and how they are funded.
In the case of the CSJ, it is a private company, founded to further the political views of an ex-Leader of the Opposition and his chief of staff, puts ‘family breakdown’ at the top of its list of root causes of poverty, and gets the largest chunk of its funding from unnamed individual donors.
None of that is to discredit its output entirely, just consume it - as with everything else - with the appropriate dosage of salt.
Ethnic inequalities hidden in neighbourhood figures
There’s a new paper out from a set of academics, led by Queen’s University, Belfast, which has dug into deprivation figures and discovered hidden pockets of deprivation.
By looking at neighbourhood-level data, and splitting it out by ethnicity, the academics have been able to identify disparities which are hidden by the average figures for those areas.
They’ve collected deprivation data across a range of measures, then ranked it form 0-1 (least to most deprived), and called it the Ethnic Group Deprivation Index (EGDI).

The above chart shows the range in EGDI - so, the areas in red everyone in those places is experiencing deprivation broadly the same. The blue, green and yellow areas are showing greater variation - meaning while some in those places are experiencing high relative deprivation, others may be doing relatively well.
It’s not the clearest, but generally big cities are where the variation is between ethnicities.
In the North East, 46.78% of neighbourhoods fall into the red category - so not a lot of variation. Across the country as a whole, 30.82% of neighbourhoods are in the lowest band.
The North East is not a particularly diverse region, and has generally lower levels of income, education and so on - so it makes sense there’s less scope for variation. There are also fewer neighbourhoods where there’s enough ethnic diversity to get proper data.
The paper does pick out one area in Newcastle - specifically in Fenham, a few streets surrounding Dame Allen’s and bordering Nuns Moor - as an example of an area with a big range. In that area, the White British Population (over 400 people) sits in the least deprived decile, while the Pakistani population (about 200 people) sits in the second highest decile for deprivation. The paper says this is an area “where people in the Pakistani group are recorded as enduring high levels of deprivation while living proximate to White British people with much lower levels of deprivation.”
This kind of hidden experience is so powerful to uncover, and so useful for policymakers.
The paper is a great piece of work, and stuck me as a really interesting example of how averages hide realities - something to be alert for in official statistics.
There were 425 homeless people in the North East at the last Census
I’ll start by saying I suspect all of these figures are an underestimate, and that there’s a very specific definition of homeless they use, i.e. people who were in hostels and temporary shelters on Census day.
But of the 13,955 people experiencing homelessness in England and Wales at that point, 425 of them were in the North East.
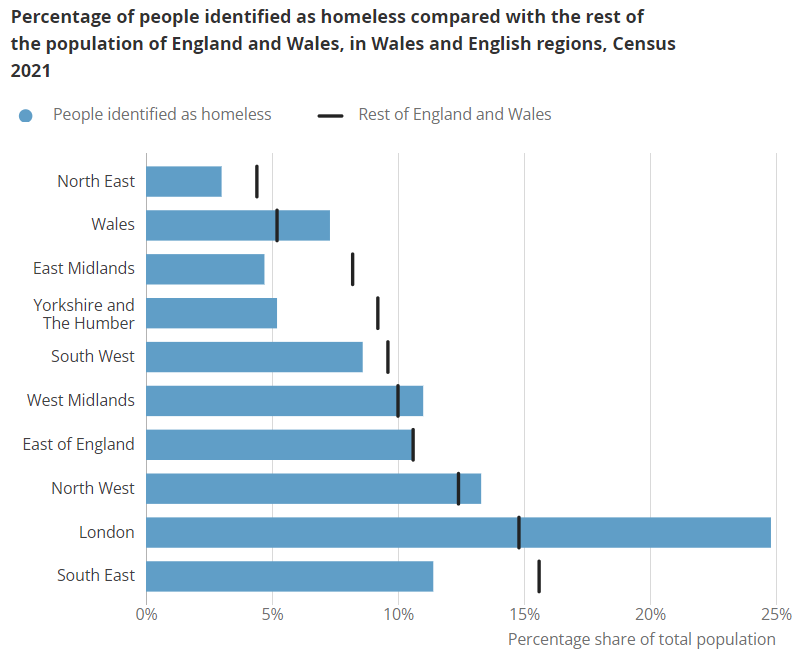
We had 3.0% of the homeless population, and 4.4% of the rest of the population, so under-represented. London manages to skew the figures somewhat by accounting for 24.8% of the total homeless population.
At the local authority level you get a sense of the incompleteness of the figures, as Hartlepool, Redcar & Cleveland, Sunderland and Gateshead all declare no homeless people at all - and I simply refuse to believe that.
Newcastle - as you’d expect for the biggest city - has the highest number of homeless people reported, with 110. That’s 0.8% of the national total, against 0.5% of the country’s total population.
Unemployment still experimental
The ONS is still turning out experimental stats in place of the regular Labour Force Survey numbers on unemployment.
The unemployment rate being reported for the North East is 4.1%, it was 4.2% in the last set of ‘proper’ figures from four months ago. Nationally the estimate is 4.3%.
Since then they’ve been extrapolating, using that last set of figures as the base, and estimating what’s going on based on payroll stats from HMRC and the Claimant Count.
The ONS have promised a new methodology for the New Year.
What I’ve been reading this week
This from Jonathan Liew on Joey Barton’s latest bit of LOOK-AT-ME-ism, which is perhaps more dangerous than it appears. He’s appealing to a group of men - young men predominantly - who feel detached and disenfranchised. And he’s someone with a history of horrific, violent behaviour and toxic views - he’s using his platform to further those views and build an audience for them that insulates him from the impact of his words and actions.
The Northern Agenda had a story this week on variation in cancer mortality, and how in some parts of the country you’re far more likely to die of cancer before the age of 80 than in other parts. The highest rate in the North East was in Middlesbrough, with 16.7% of women there expected to die of cancer before the age of 80.
What’s coming up in the next week or so?
PMQs later, which I expect will mostly be about Rwanda
Big Select Committee day - the two new immigration ministers are visiting the Home Affairs Committee, Kemi Badenoch is up in front of the Women and Equalities Committee and Health Secretary Victoria Atkins is due to face questioning from the Health and Social Care Committee too
The Bank of England’s interest rate might change tomorrow, but expectation is that the Monetary Policy Committee will vote to hold rates as they are
ONS GDP and trade figures are also due tomorrow
Some analysis on who is most likely to have homes which are hard to keep warm, due tomorrow
Inflation figures due this time next week
Working with me
I’m working to the end of next week, then off through Christmas and the first week of January - so next week’s will be the last proper newsletter of 2023.
2024 is the year we’ll maybe get a General Election (I still think they’ll hang on as long as they can, so don’t rule out January 2025 for that), and the year we’ll definitely get a mayor for the whole of the North East (excluding the bit that’s the Tees Valley)…so, there’ll probably be lots to work on. Give me a shout to chat about it.
You can find out more about me on my website.
You can email me on worroom@substack.com or arlen@arlenpettitt.co.uk
I’m @arlenpettitt on Twitter, and you’ll find me on LinkedIn and on Bluesky too.